
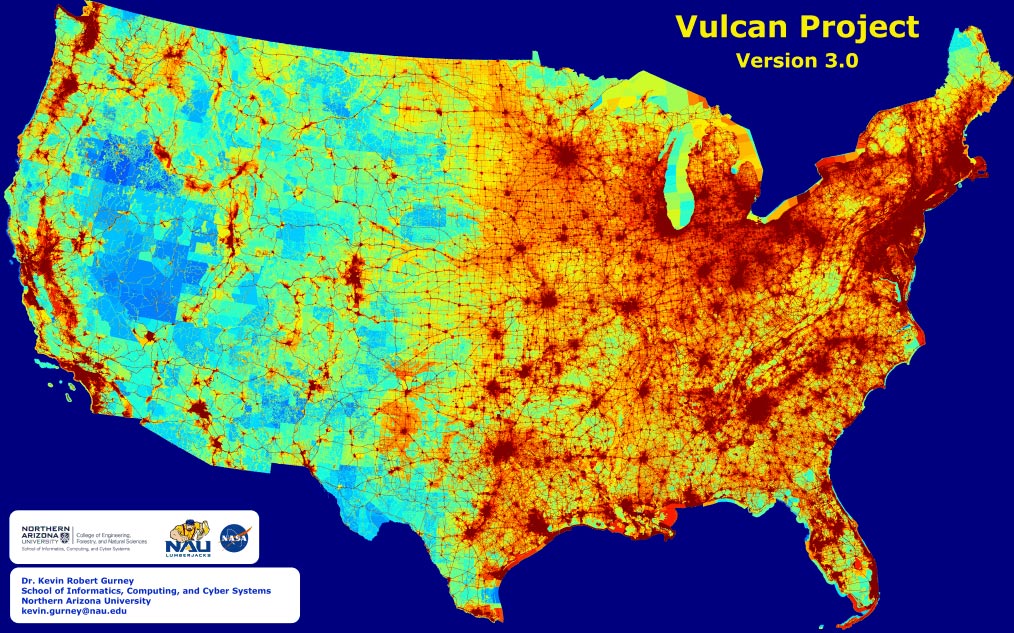
Emission map of the entire US landscape with high spatial and temporal resolution with details on the economic sector, fuel and combustion process. Photo credit: Courtesy of Northern Arizona University
The map shows greenhouse gas emissions across the US landscape at a high spatial and temporal resolution with details on the economic sector, fuel and combustion process.
With intense forest fires in the western United States and frequent, intense hurricanes in the Gulf of Mexico, the nation is once again hit by extreme weather-related events as a result of climate change. In response, cities, states, and regions across the country are developing strategies to reduce their greenhouse gas emissions, primarily carbon dioxide (CO2). While many state and local governments are committed to these goals, the emissions data they have to work with are often too generic and expensive to provide a useful basis for the most effective policies.
Professor Kevin Gurney of the School of Informatics, Computing and Cyber Systems at Northern Arizona University published results today in the Journal of geophysical research Detailing the greenhouse gas emissions in the entire US landscape with high spatial and temporal resolution with details on the economic sector, fuel and combustion process.
Gurney, who specializes in atmospheric science, ecology, and public order, has developed a standardized system over the past few years as part of the Vulcan project that quantifies and visualizes the greenhouse gases emitted across the country, down to individual power plants, neighborhoods, and streets , Identifying problem areas and making better decisions about where to cut emissions most effectively. In the run-up to the nationwide study, Gurney created emission maps of several different cities, including the mega-city Los Angeles, Indianapolis, the metropolitan area of Washington, DC / Baltimore and Salt Lake City.
Funded by NASAGurney developed the high resolution emissions map as a powerful tool for scientific and political applications. Its aim is to enable policymakers across the country to tackle problem areas strategically, rather than taking an inefficient and costly approach.
“We supply US politicians at the national, state and local levels with a scalpel instead of a hammer. Policies that might be relevant to California may be less relevant to Chicago or New York. They need information that reflects their particular conditions but follows a rigorous, standardized scientific approach. That way, they can have confidence in the numbers, which in turn inspire smart investments in reducing emissions. ”
One of the strengths of Gurney’s approach is the validation through atmospheric monitoring of CO2 of ground and satellite instruments.
“By synthesizing the details of building and street-scale emissions with independence and accuracy In terms of atmospheric monitoring, “Gurney said,” we have the best possible estimate of emissions with the most politically relevant details. ”
By characterizing CO2 Gurney points out that the system provides every US city with an inventory of emissions across the US countryside per kilometer from coast to coast. “By extracting all cities in the US from our data product, we can provide each city with a consistent and comprehensive assessment of their emissions. Like the U.S. weather forecasting system, the best way to solve this problem is with a single systemic approach and share it with city stakeholders so they can do what they can do better than anyone – reduce emissions in ways that suit their individual needs corresponds. “Said Gurney.
Reference: “The high-resolution fossil fuel CO from Vulcan version 3.02 Emissions for the United States ”by Kevin R. Gurney, Jianming Liang, Risa Patarasuk, Yang Song, Jianhua Huang and Geoffrey Roest, September 15, 2020, JGR atmospheres.
DOI: 10.1029 / 2020JD032974
Data from the Vulcan mapping project is available at the Oak Ridge National Laboratory Data Archive. Visit the Vulcan website for more images. This research was made possible with support from the National Aeronautics and Space Administration Grant NNX14AJ20G and the NASA Carbon Monitoring System program “Understanding User Needs for Carbon Information” (subcontract 1491755).
Gurney joined NAU in 2018, where he continues the research he started in roles at other universities. He has been involved in the United Nations Framework Convention on Climate Change and the Kyoto Protocol for 25 years and is the lead author of the Intergovernmental Panel on Climate Change (IPCC). In addition to his interests in carbon cycle science and politics, he has worked on the depletion of the ozone layer in the stratosphere, radionuclide dose assessment, energy systems, and climate modeling.