
Figure 1. The difference between the pre-impact DEM and the post-impact DEM around the SCI impact point. The color scale indicates the height of the surface morphology in meters, and the dotted semicircle shows the SCI crater rim. Photo credit: Kobe University, JAXA, Tokyo University, Kochi University, Rikkyo University, Chiba Institute of Technology, Meiji University, Aizu University, AIST.
The artificial impactor disrupted boulders within a radius of 30 m from the center of the impact crater and provided important insights into the re-emergence processes of asteroids.
Professor ARAKAWA Masahiko (Graduate School of Science, Kobe University, Japan) and members of the Hayabusa2 mission discovered more than 200 boulders ranging in size from 30cm to 6m that either re-emerged or moved due to the artificial impact crater created by the Japanese April 2019, the Small Carry-on Impactor (SCI) of the Hayabusa2 spacecraft was deployed. Some boulders were even disturbed in areas up to 40 m from the center of the crater.
The researchers also discovered that the seismic shaking area, where the surface blocks were shaken by the impact and moved an order of centimeters, extended about 30 m from the center of the crater. Hayabusa2 obtained a surface sample at the north point of the SCI crater (TD2) and the thickness of the ejecta deposits at this point was estimated to be 1.0 mm to 1.8 cm using a digital elevation map (DEM).
This knowledge about the re-emergence processes of a real asteroid can be used as a benchmark for numerical simulations of small body influences, in addition to artificial impacts in future planetary missions such as NASADouble Asteroid Redirection Test (DART). The results will be presented at the 52nd session of the AAS Planetary Science Division on October 30th at the session titled Asteroids: Bennu and Ryugu 2.
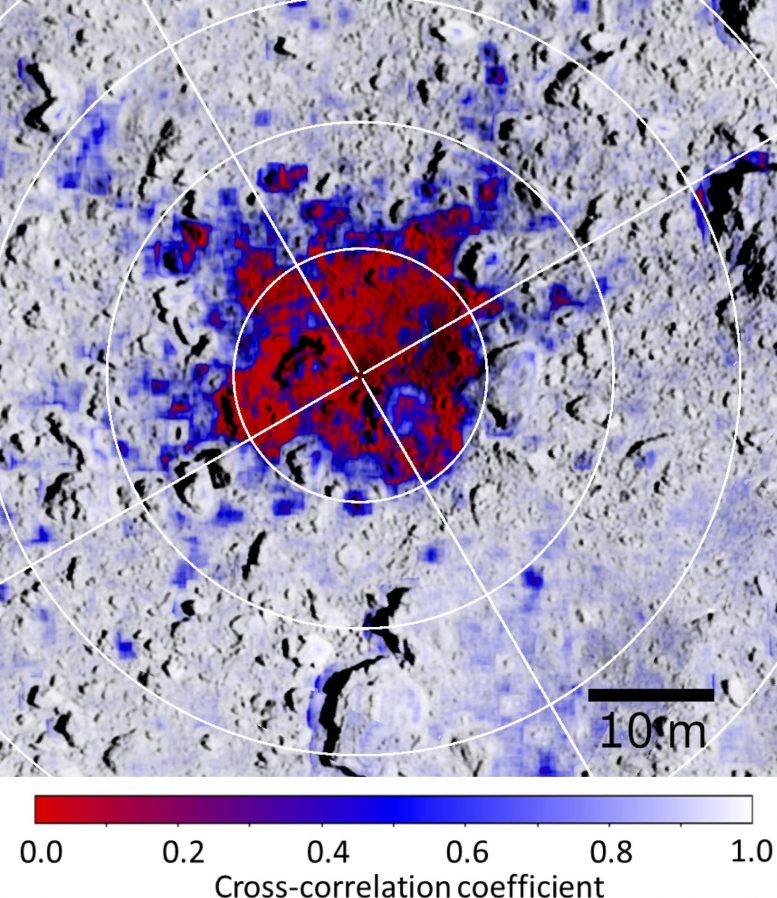
Figure 2. Cross-correlation coefficient map of the area around the SCI crater overlaid on the image after impact. The cross-correlation coefficient is described by the color gradient on the map. Numbers and arrows indicate four projections showing the low cross-correlation coefficient. Photo credit: Kobe University, JAXA, Tokyo University, Kochi University, Rikkyo University, Chiba Institute of Technology, Meiji University, Aizu University, AIST.
The objective of impacting Ryugu with a ~ 13 cm SCI projectile was to obtain a sample of the underground material. In addition, this provided a good opportunity to study the surface renewal processes (surface renewal) that result from impact with an asteroid with a surface gravity of 10-5 the gravity of the earth.
The SCI managed to create an impact crater defined as the SCI crater 14.5 m in diameter (Arakawa et al., 2020) and the surface sample was sampled at TD2 (10.04 ° N, 300.60 ° E) won. It was found that the concentric area of the crater center, the radius of which is four times the radius of the crater, was also disturbed by the SCI impact, causing the rock to move.
The researchers then compared surface images before and after the artificial impact to investigate the surface renewal processes associated with crater formation, such as seismic shaking and ejecta deposits. To this end, they created SCI crater rim profiles using a digital elevation map (DEM), which consists of the DEM subtracted from the post-crash DEM before the crash (Figure 1).
The average rim profile was approximated by the empirical equation of h = hrexp[-(r/Rrim-1)/λrim] and the adjusted parameters of Hr and meedge were 0.475 m and 0.245 m respectively. Based on this profile, the thickness of the ejecta cover of the SCI crater was calculated and found to be thinner than that of the conventional result for natural craters and that calculated from crater formation theory. However, this discrepancy was corrected by taking into account the impact of the boulders that appeared in the images after the impact, as the crater rim profiles derived from the DEMs may not have been able to detect these new boulders. According to this crater rim profile, the thickness of the ejecta deposits at TD2 was estimated to be 1.0 mm to 1.8 cm.
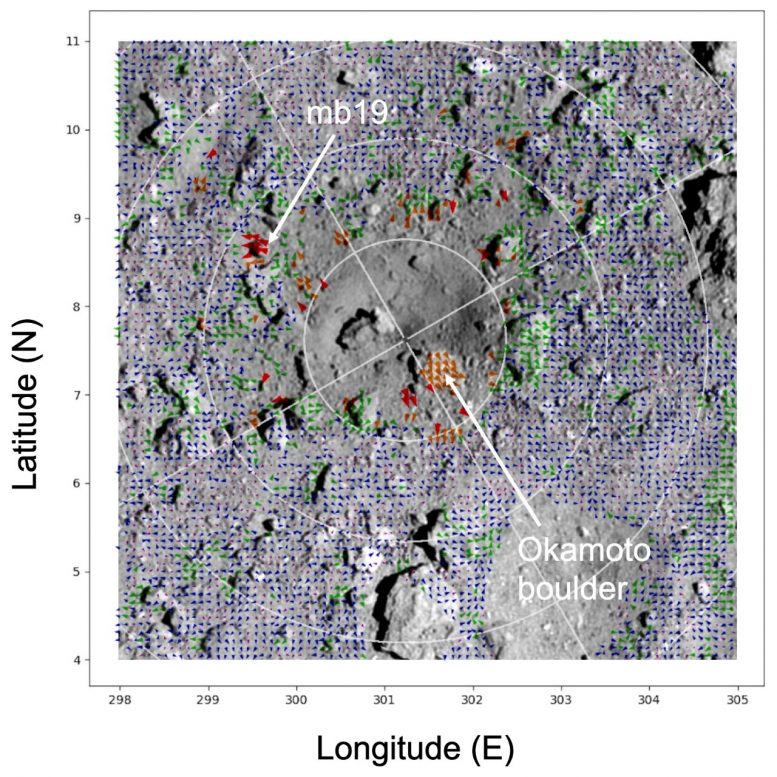
Figure 3. The distribution of motion vectors around the SCI crater. The arrows indicate the movement of each rock from its original position as a result of impact. Each color shows the distance traveled as follows: purple for 0-1 cm, blue for 1-3 cm, green for 3-10 cm, orange for 10-30 cm and red for 30-100 cm.
Photo credit: Kobe University, JAXA, Tokyo University, Kochi University, Rikkyo University, Chiba Institute of Technology, Meiji University, Aizu University, AIST
The 48 boulders in the post-impact image could be traced back to their original positions in the pre-impact image, and it was found that the 1 m boulders were ejected several meters outside the crater. They were divided into the following four groups according to their movement mechanisms: 1. Excavation flow, 2. Pressed by falling ejection, 3. Surface deformation from the slight movement of Okamoto Rock, and 4. Seismic shaking from the SCI impact itself. In all groups seemed radiate the motion vectors of these boulders from the center of the crater.
The 169 new boulders with a size of 30 cm to 3 m were only found in the pictures after the impact and were distributed up to ~ 40 m from the center of the crater. The histogram of the number of new boulders was examined at each radial width of 1 m at a distance of 9 to 45 m from the crater center, with the maximum number of boulders found at a distance of 17 m. Beyond 17 m, the number of boulders decreased with increasing distance from the crater center.
To investigate this further, a correlation coefficient evaluation was carried out between the images before and after the impact. The area of low cross-correlation coefficient outside the SCI crater was discovered to have an asymmetrical structure (Figure 2), very similar to the area around the point of impact where ejecta were deposited (Arakawa et al., 2020).
Based on a template matching method using the correlation coefficient assessment, the Boulder displacements with cross-correlation coefficients above 0.8 were derived with a resolution of ~ 1 cm. This suggested that these shifts could be caused by seismic shaking (Figure 3). The boulders were moved more than 3 cm near the SCI crater. This perturbation extends up to 15 m from impact, with motion vectors emanating from the center of the crater. In the regions that are more than 15 m away from the center, there are still disturbed areas that were offset by 10 cm. However, they appeared as spots a few meters in size and were randomly distributed. In addition, the direction of these motion vectors in the distant regions was almost random and there was no clear indication of the radial direction from the crater center.
Displacements of more than 3 cm were found at a distance of 15 m with a probability of more than 50% and between 15 and 30 m with a probability of approximately 10%. Therefore, Arakawa et al. propose, in accordance with Matsue et al. (2020) experimental results that the seismic shaking caused most of the boulders in the area to move with a maximum acceleration seven times greater than Ryugu’s surface gravity (gRyugu). In addition, they found that the impact moved boulders with a maximum acceleration between 7 gRyugu and 1 gRyugu in about 10% of the area. It is hoped that these results will influence future numerical simulations of small body collisions as well as planetary missions with artificial impacts.
Presented at the American Astronomical Society’s 52nd Annual Meeting of the Department of Planetary Sciences (Session: ‘Asteroids: Bennu and Ryugu 2’) on October 29, 2020.
Corresponding author: Masahiko Arakawa Graduate School of Science, Kobe University.
thanksgiving
This work was supported in part by Scientific Research Grants (No. 17H06459 and No. 19H00719) from the Japanese Ministry of Education, Culture, Sports, Science and Technology. This study was supported by the JSPS core-to-core program “International Network of Planetary Sciences”.
References
- Arakawa et al., 2020. An artificial impact on the asteroid (162173) Ryugu formed a crater in the gravity-dominated regime. Science. 368, 67- 71.
- Matsue et al., 2020. Measurements of seismic waves induced by high speed impact: implications for seismic shaking around impact craters on asteroids. Icarus. 338, 113520.
Meetings: 52nd Annual Meeting of the American Astronomical Society’s Department of Planetary Sciences
Funding: Ministry of Education, Culture, Sports, Science and Technology (Japan), Japan Society for the Advancement of Science.